What is a Fair Shares Formula?
Resource allocation
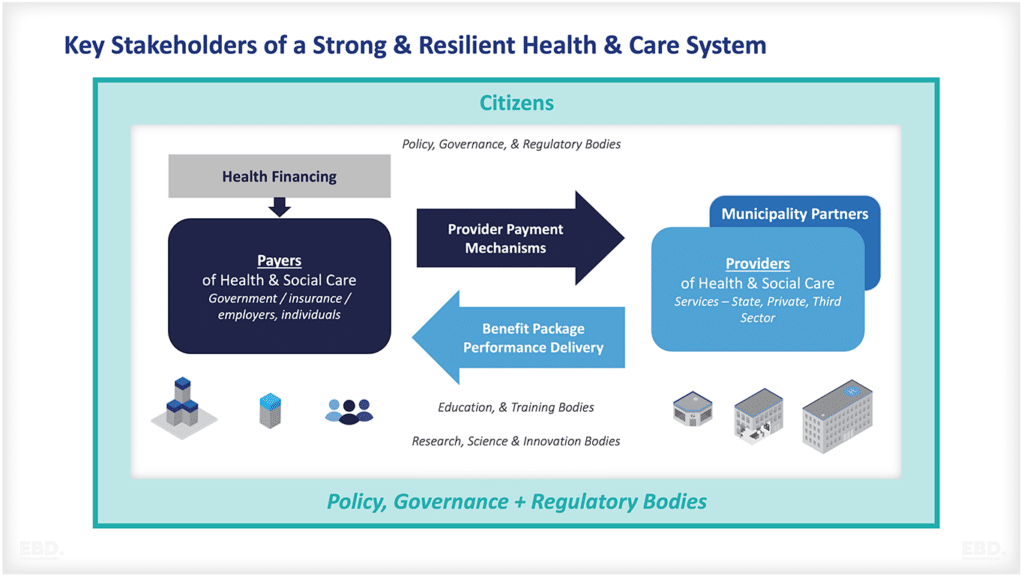
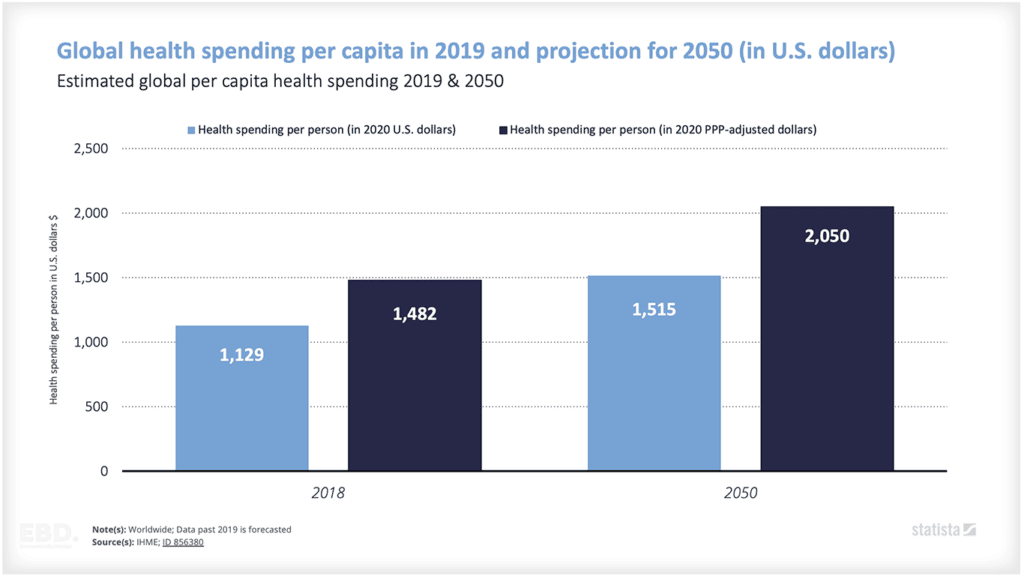
Government funded health services account for around 60% of health expenditure [1]. One of the big challenges facing governments is how to share these resources across geographies, and populations to enable equity of access to services locally.
One of the earliest examples of a ‘fair shares” formula was the one used by the NHS in England to allocate resources to regional health authorities. Known initially as the Crossman Formula [2], the approach was developed by a working party established in 1975 known as the Resource Allocation Working Party (RAWP).
The RAWP formula, was used to set target funding allocations based on giving populations equal access to health services for those in equal need. The formula was relatively crude but represented a huge improvement on the historic funding which preceded it and showed huge unwarranted disparities in funding, especially favouring London.
In my early days at H.M. Treasury in the late 1980’s, I was part of the review of RAWP. This review resulted in the establishment of a more complex formula which has been successively improved on ever since.
As it improved, instead of being used to allocate funds to 14 regions it was developed to enable a capitation funding approach for over 200 local commissioning groups. The basic approach is still in use today despite several major overhauls [3].
Allocative Efficiency
Seen through an economic lens this is all about ‘allocative efficiency’, namely ensuring geographical alignment between the underlying need for health services and their supply [4].
What are the Important Design Principles?
There are several important designing principles which influence these formulas:
- The care setting (e.g., primary healthcare, hospital services, community health services, prevention etc.)
- The services being funded (e.g., maternity, mental health, general acute services)
- The determinants or factors which will influence the need for these services (e.g., size of population, demographics, socioeconomics, epidemiology etc.).
- The determinants of factors which influence the supply of these services (e.g., historical service provision, local operational policy (prevention vs treatment/response), inter-sectoral stakeholder relationships (few public services are provided in a vacuum), and alternative provision (such as the private sector).
- The influence supply has on the perceived demand for services (e.g., for those localities focusing operational policy on prevention, this may reduce caseloads which will be seen as evidence of lower demand – however underlying needs may not have altered at all).
- Unavoidable differences in costs (e.g., particularly due to local labour market conditions).
- The Government’s strategic policy objectives for these services and whether certain practices need to be incentivised or discouraged. A good example of this is the current NHS priority on reducing surgical waiting lists.
- The timeliness, frequency, and accuracy of data available to keep the formula up to date.
- The clarity and transparency of the formula and perceptions of “fair shares”.
- Locality level target allocations vs current allocations, distance from target.
- The stability of target allocations as data are updated from year to year.
- The policy covering pace-of change from current to target allocations.
That’s quite a lot to consider. It’s not surprising, therefore, that there is always a healthy methodological debate about what should be included and excluded, what data to use, and how to ensure that the formula is genuinely fair. It is no surprise either that there is an army of health economists who have dedicated their careers to this challenge.
Levelling across vs levelling up
One of the biggest challenges of a fair shares’ formula is the implication that you need to move money from one area (the losing area) to another (the gaining area). This is tricky from a political and a policy perspective.
It is tricky even if the area losing has relatively low need but has previously been well endowed with resources and the area gaining has relatively high need, but historically experienced low levels of resources. However, it is even more difficult if an area of high need is also a loser.
Think about Area A compared to Area B – the same size in terms of population. If we assume that Area A is 10% more needy than Area B, then allocating based on need would give Area A 55% of the funds available.
But what if Area A had historically received 70% of funding. Allocative efficiency suggests we should move money away from Area A and give it to Area B even though Area B is less needy.

Governments often adopt policies regarding ‘movement to target” or ‘pace of change” which try to address these challenges by using new funding, or budget increases to rebalance.
New money each year goes to “gaining areas” and “losing areas” have their current budgets protected. The problem with this “levelling up” is that it can literally take a generation to address historical inequities.
Integrated Care Systems
It will be interesting to see how things progress for the NHS in England as the new Integrated Care Systems are established. The formula will essentially be used to allocate resources to 42 health systems, leaving them much discretion in how to allocate funds to localities and neighbourhoods.

It is likely that Integrated Care Systems will have to balance strategic purchasing, capacity development, and targeted initiatives for improving population health and reducing health inequalities. Maybe the formula approach to fair shares funding will in future be limited to regional distributions?
[1] https://www.economicsbydesign.com/the-economics-of-health-financing-how-much-is-enough/
[2] https://www.kingsfund.org.uk/sites/default/files/field/field_publication_file/improving-the-allocation-of-health-resources-in-england-kingsfund-apr13.pdf
[3] https://www.england.nhs.uk/publication/infographics-fair-shares-a-guide-to-nhs-allocations/
[4] https://www.economicsbydesign.com/economics-and-value-based-healthcare/